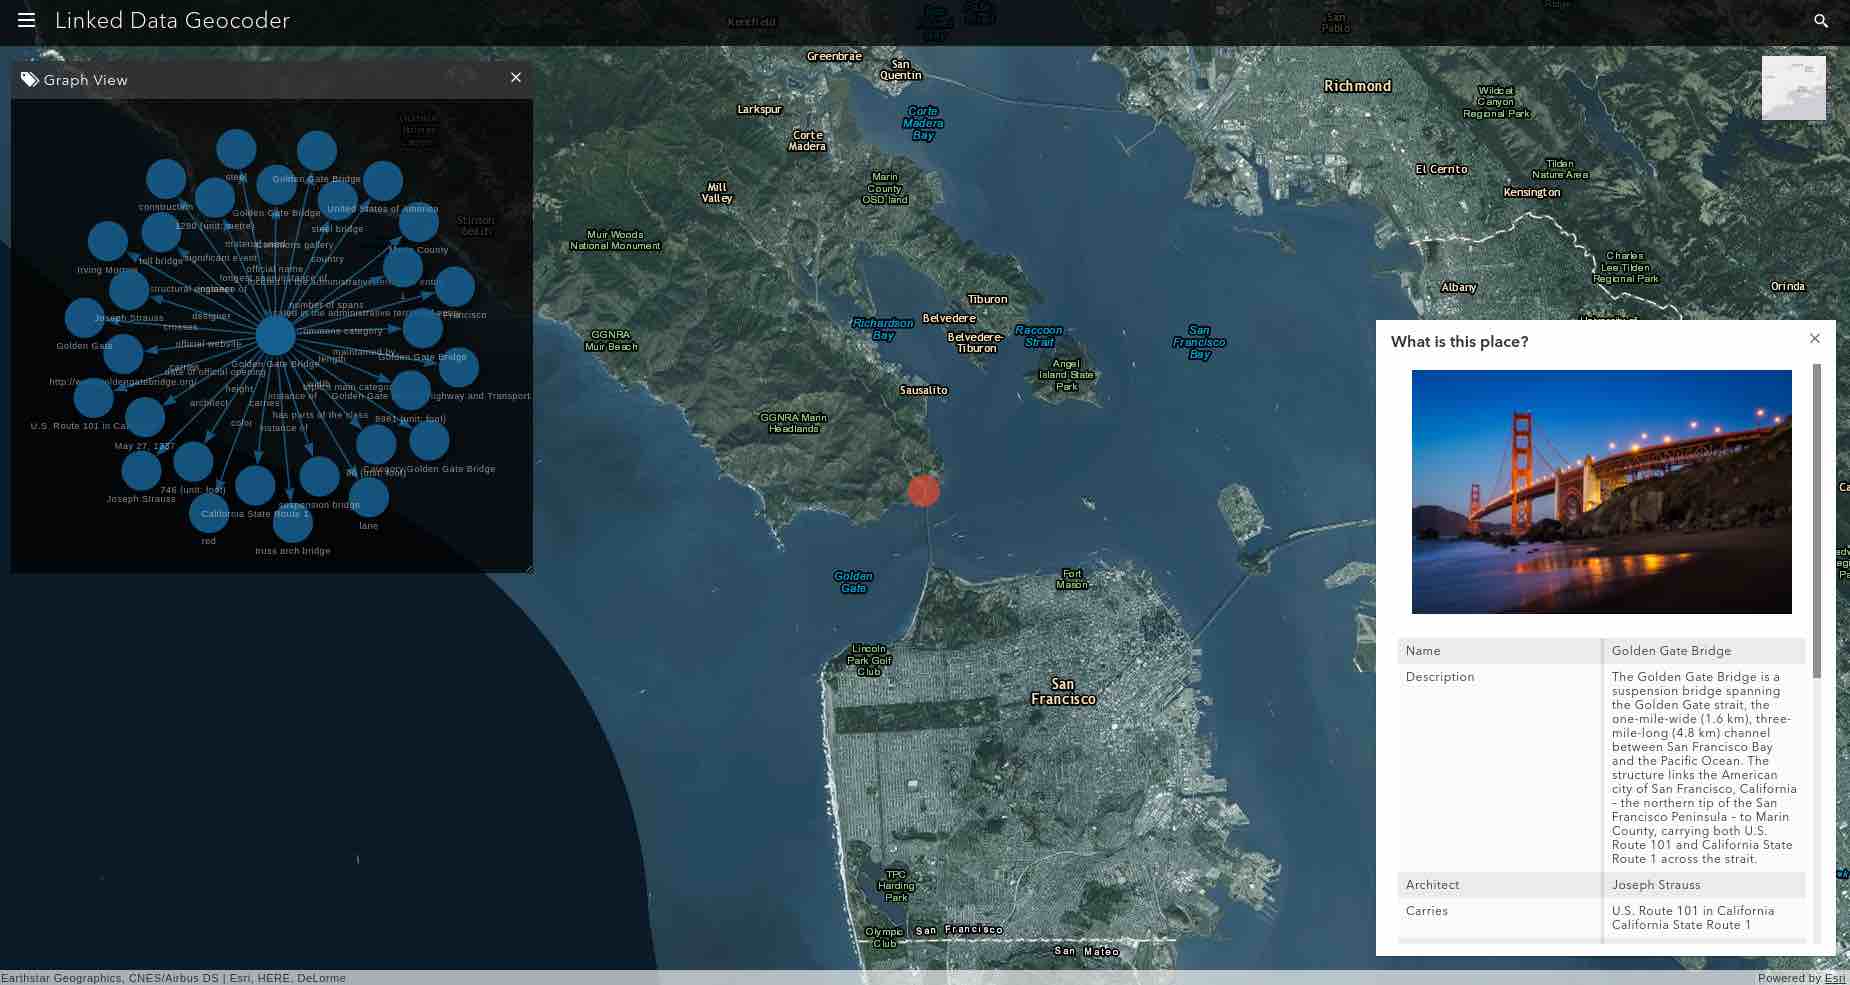
Linked Data Geocoder is a project that aims to incorporate spatial knowledge into geocoding services (such as ESRI geocoding services) using Geospatial Linked Open Data. OpenStreetMap and GeoNames are used as access points to the Linked Data Cloud. DBpedia and Wikidata are used as sources of spatial knowledge. An on-the-fly matching algorithm is implemented to match place entities from geocoding services with the ones from Linked Data using spatial footprints and toponyms. The web map provides both a list view and graph view for users with different needs. The whole project is deployed in Amazon Web Services to take advantage of the serverless and scalable architecture.
Technology Stack: Python Flask, ArcGIS JavaScript API 4.0, ESRI geocoding services, SPARQL, vis.js, AWS Lambda
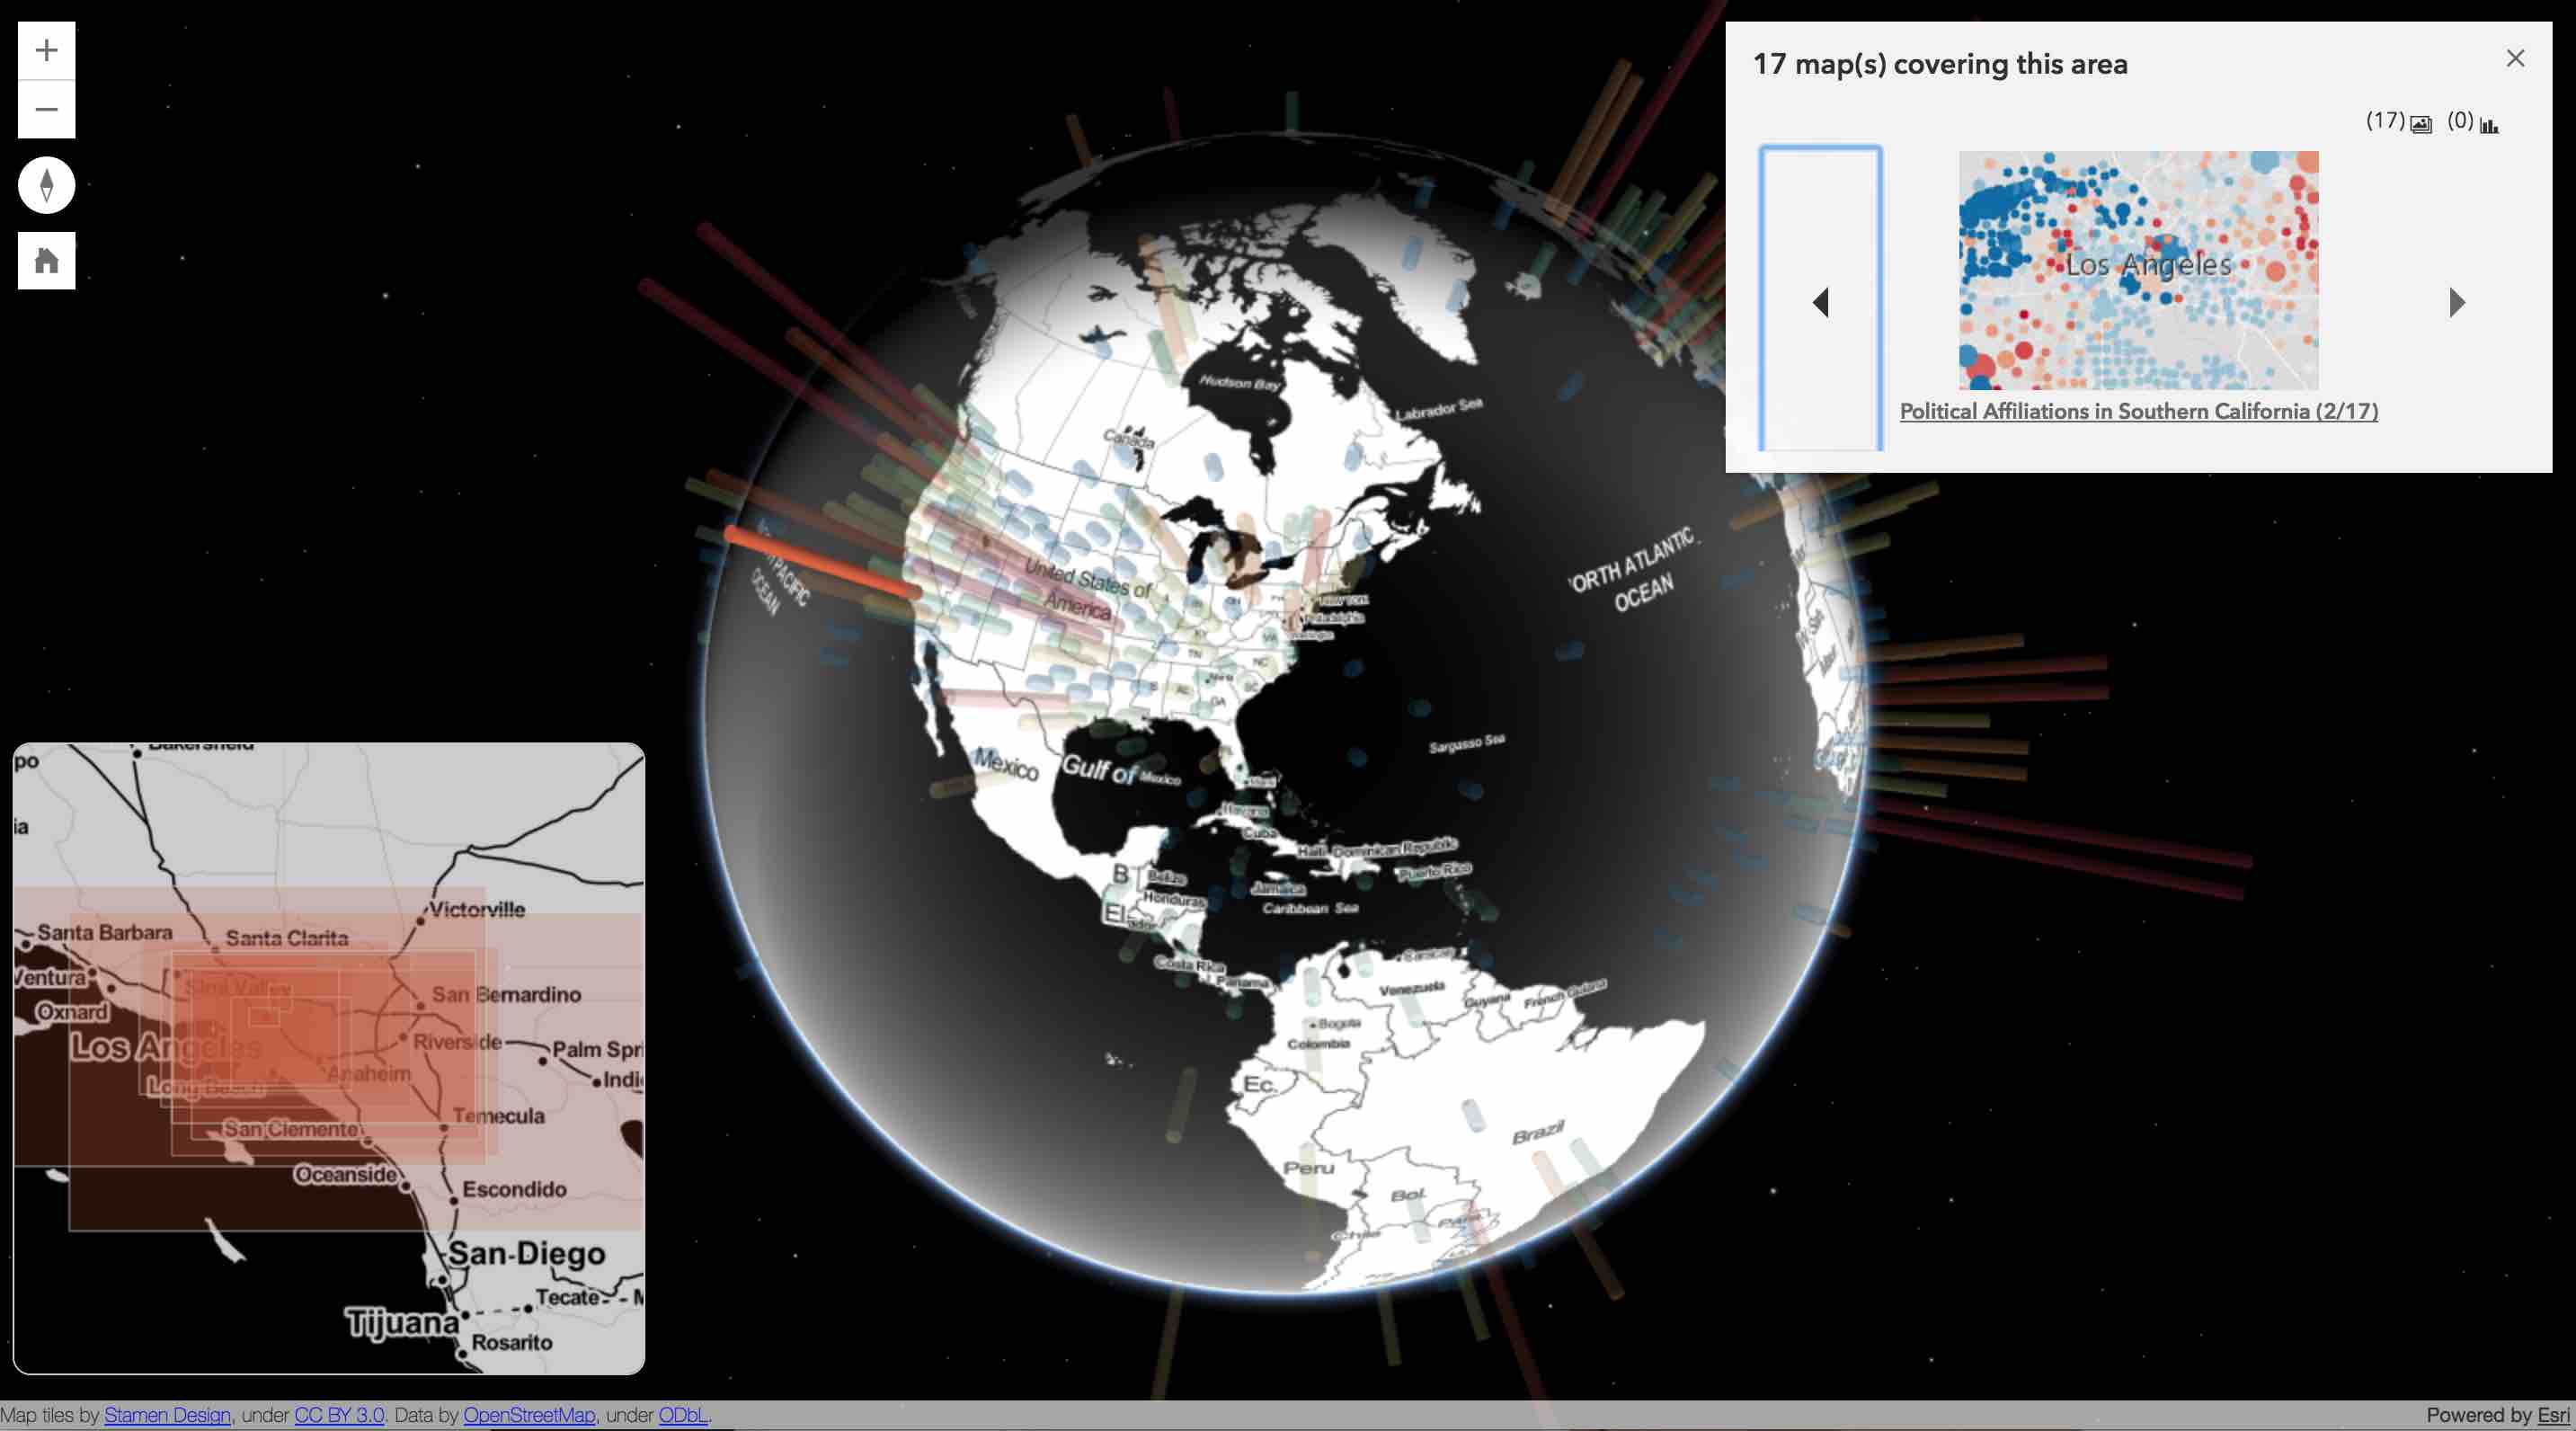
This interactive 3D visualization helps people explore and navigate through the ESRI Living Atlas online portal from a geographic point of view. The extrusion visualization facilitates users to quickly get an idea of the spatial distribution of the map data and know whether desired maps are available in their areas of interest.
Technology Stack: ArcGIS JavaScript API 4.0, ArcGIS REST API, Python, D3.js
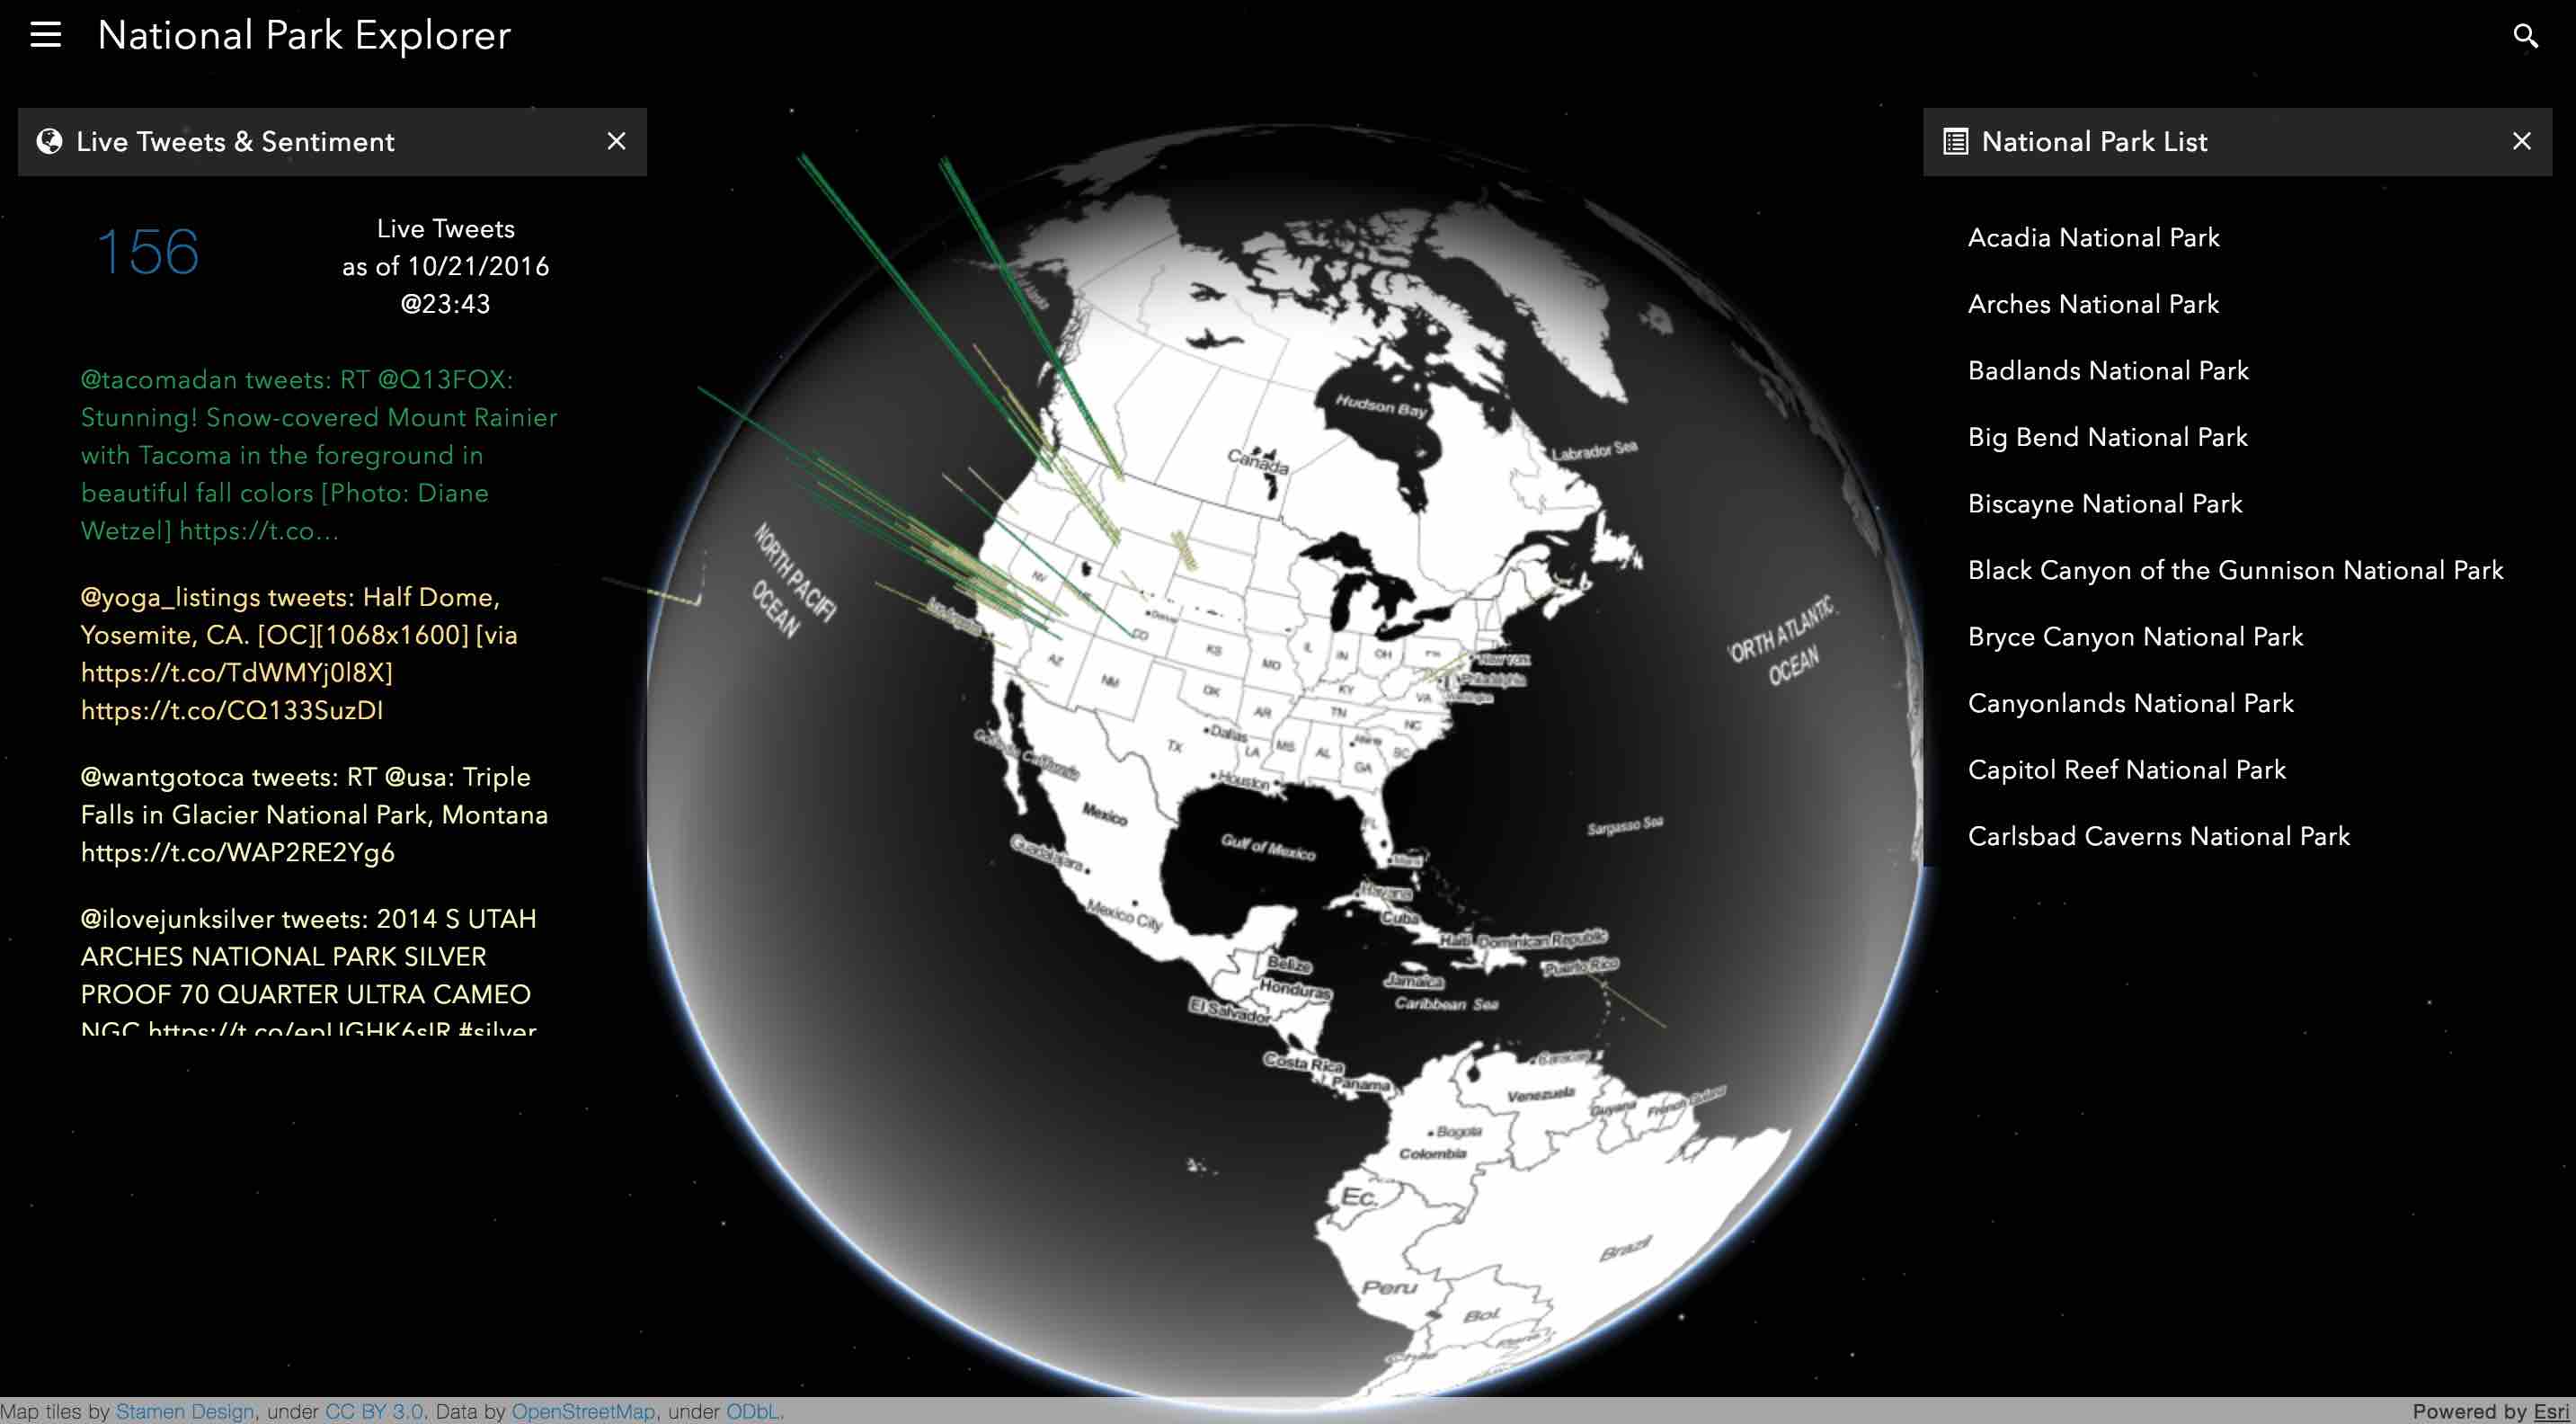
This project was done wihtin 40 hours and won the 1st place in 2016 ESRI Intern Hackathon. This 3D web mapping application allows people to find and explore their perfect national park based on personal interests, live opinions, and seasonal popularity. We used topic modeling to generate topics for national parks. Live tweets are retrieved with sentiment scores to show people's opinions of the parks. An optional temporal heat map layer is provided to show seasonal popularity of the parks.
Technology Stack: Python Flask, ArcGIS JavaScript API 4.0, socket.io, Latent Dirichlet allocation (LDA), gensim, D3.js, twitter streaming API
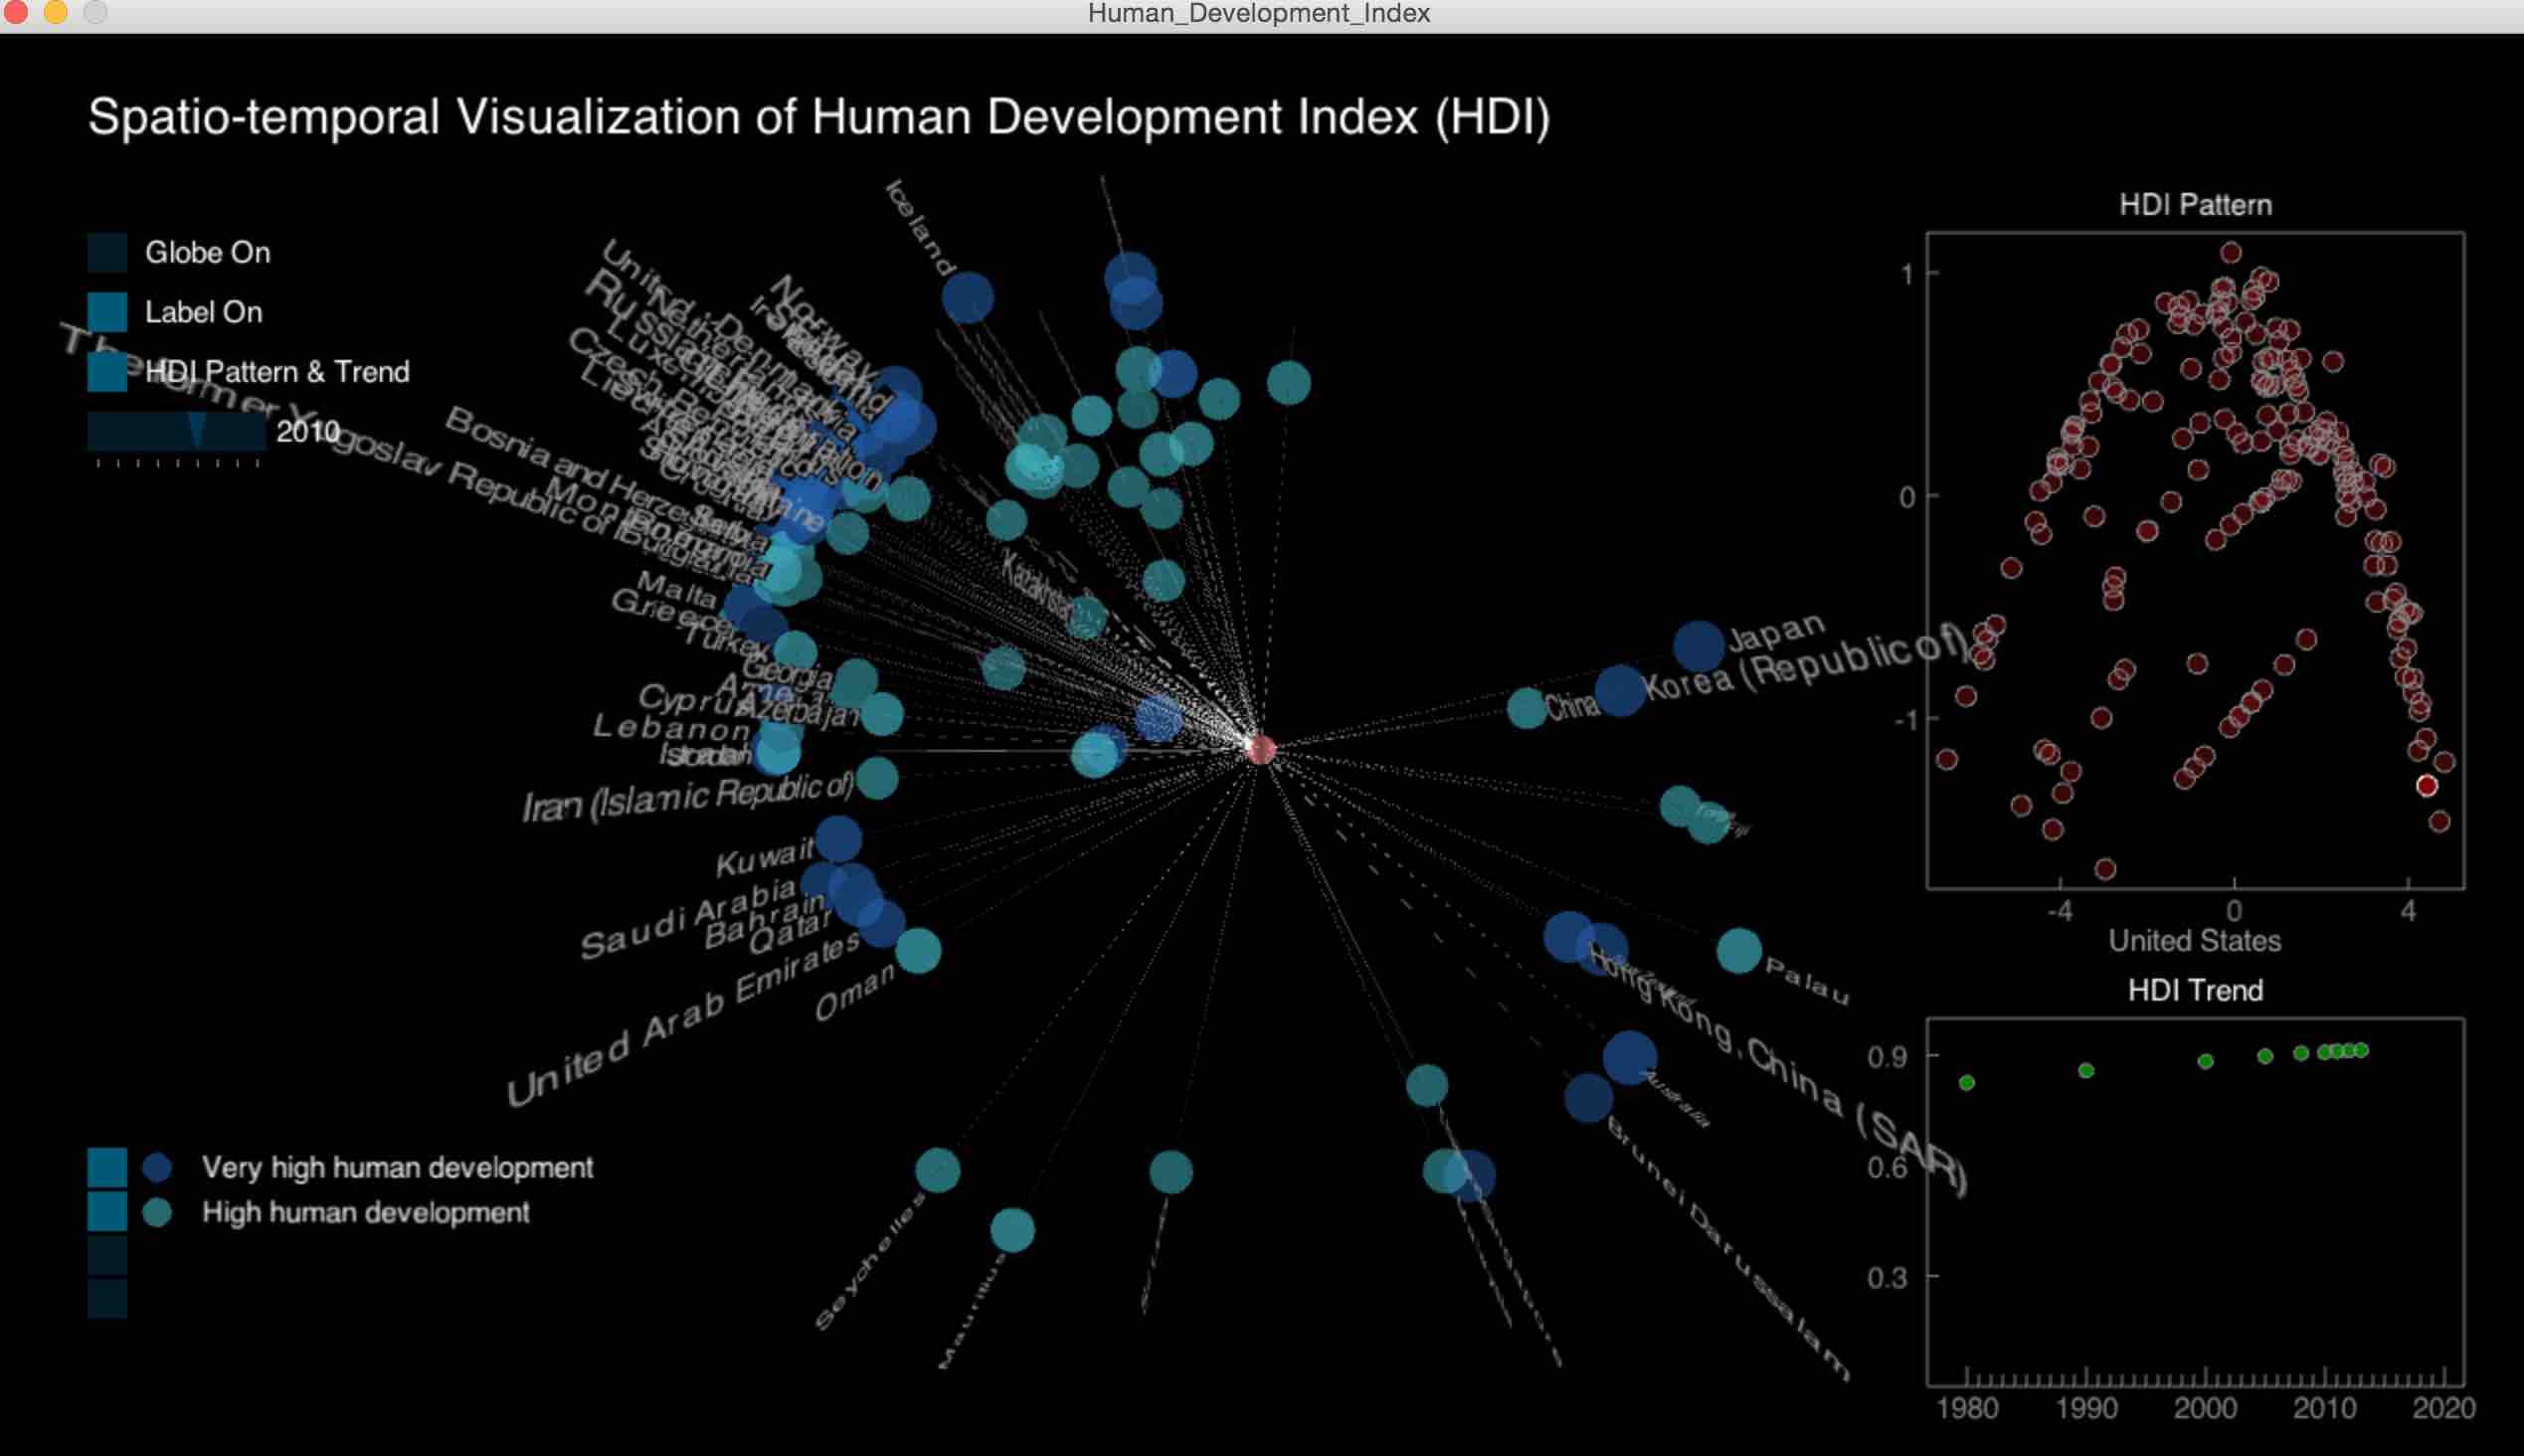
This visualization takes advantage of the Human Development Index (HDI) data collected from the United Nations Development Program API. The data covers 187 countries and regions across 9 years. Each country is represented by its capital city. Each country or region is marked as a point and the size of the point represents the HDI value, the larger the point size, the bigger the HDI value. HDI trend is also visualized. Multidimensional Scaling (MDS) was performed in order to project the data into a 2D space. In the HDI pattern, countries or regions with similar HDI trends are close to each other.
Technology Stack: Python, Processing